To learn how America can cope with demographic decline we need to address what the data is telling us. First, what is an “Aging Society”? People living longer, I suppose. That makes sense to us – right? Generally, people are living longer and dying later. The world has certainly seen broad improvements to basic medicine which prevents the common premature deaths once brought on by infection. Modern societies, like we have in America, are able to leverage deep pools of resources to further propel medical practices and prolong life. At a time when the large group of baby boomers are approaching older ages, it’s not surprising that newer phrases have emerged – like “the graying of America”.
Let’s take a look at the math involved. Society “Aging” means the average age is increasing. Intuitively, we think a greater portion of the society is living to an older age, thus moving the average up. The data actually reveals that the numerator and denominator are both moving, though. This means something different. It matters and warrants additional attention.
You see, while medical improvements have allowed for people to reach older ages, fertility rate declines have led to fewer babies being born. Not only do we have a society made up of people living longer, but we also have a smaller than expected group of younger people – moving the average age up even more.
We have too many people… but do we really?
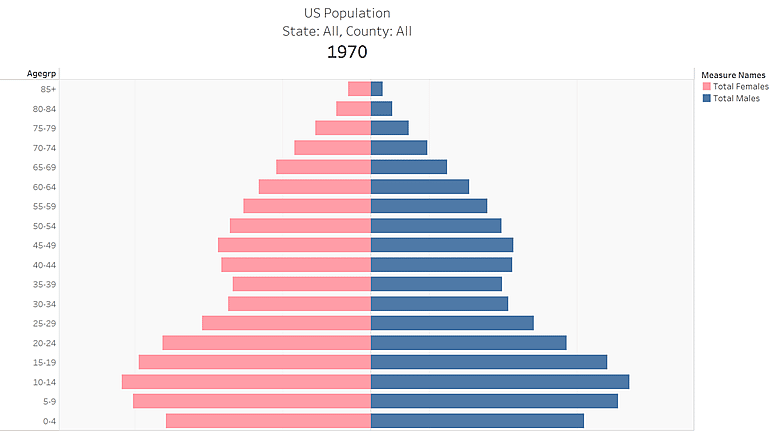
Note the triangular shape of the US population in 1970 (image below). The shape of this chart is an expected depiction of a societal structure. In fact, a “Population Pyramid” is the standard illustration used by demographers. It is made up of continuous stacked-histogram bars. It reads as a horizontal bar diagram. The population size is shown on the x-axis (horizontal) while the age-groups are represented on the y-axis (vertical). Males are shown in blue. Females are shown in pink.
For comparison, note the mostly cylindrical shape, almost mushroom like, of the same chart from 2020 (image below). A greater portion of America is noticeably older and the younger population is no longer the largest. The shape and size of our society is changing.
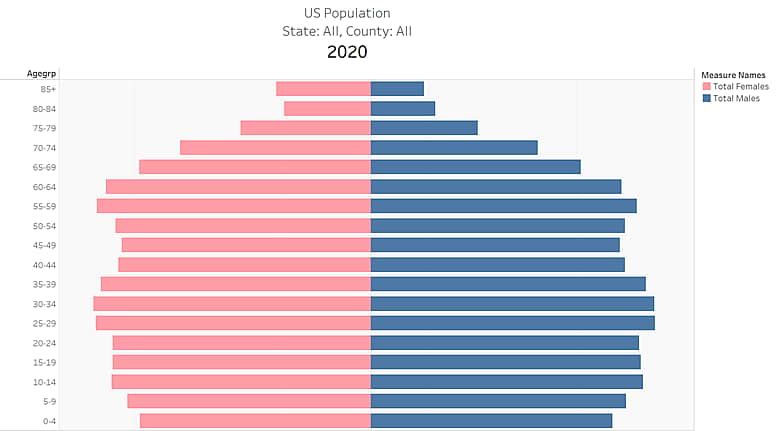
What is causing this to happen?
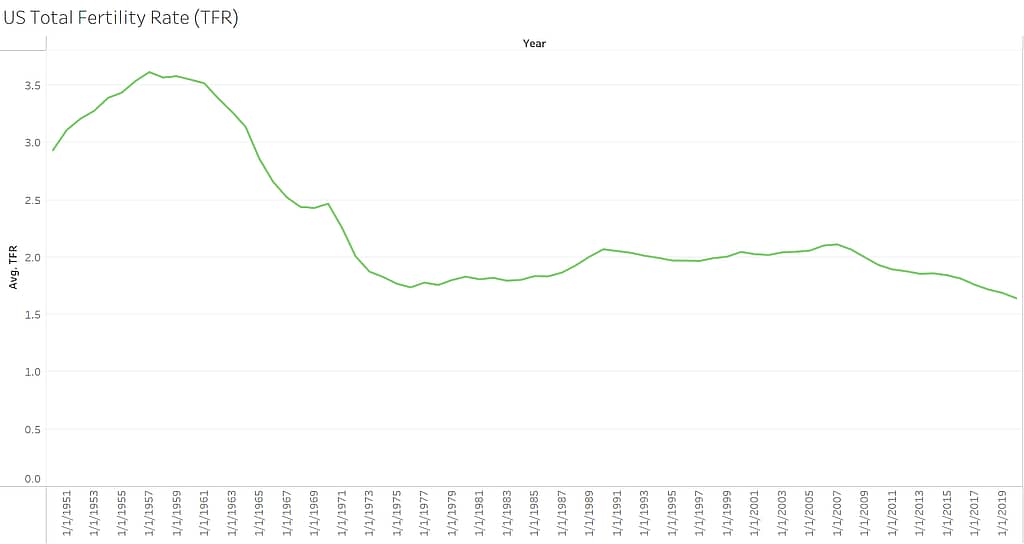
The size of the baby boomer generation, the implications to our labor force, and the resulting pressures on our social systems have long been discussed. The unexpected and abrupt nature of declining fertility rates has not been predicted. Largely depended upon models have not been accurate and many are being caught by surprise and disbelief.
People who study these trends are quick to mention the global shock of COVID and the unsettling thoughts of bringing children into this world. Many also point to the 2007-2008 financial crisis as the time when soon to be parents were concerned for the future and fertility rates began to decline. The truth is, though, this began to happen in the early 1970’s and has accelerated in the last 15 years (see chart below).
Current demographic projections
Projecting population size is not easy. The three main inputs – births, deaths, and migration are obviously hard to predict. Declining fertility is real and tangible, though. Young people today don’t share the same beliefs of having children as previous generations. Concerns of equity and the health of the environment portray a dismal outlook. It doesn’t seem likely that younger people are going to all of a sudden start having more babies, yet current modeling from the US Census Bureau and The United Nations Population Division suggest they will.
The impact of COVID and the unexpected deaths from it could never have been anticipated. Just like the potential devastation of AIDS in the early 1990’s couldn’t have been. Counteracting some medical gains, mental health, and addiction have led to an increase of deaths in recent years. So much, in fact, that life expectancy has changed as a result. Nonetheless, it’s probably a reasonable assumption, that people in general will continue to live longer in life. Many experts these days think we can live into our early 100’s.
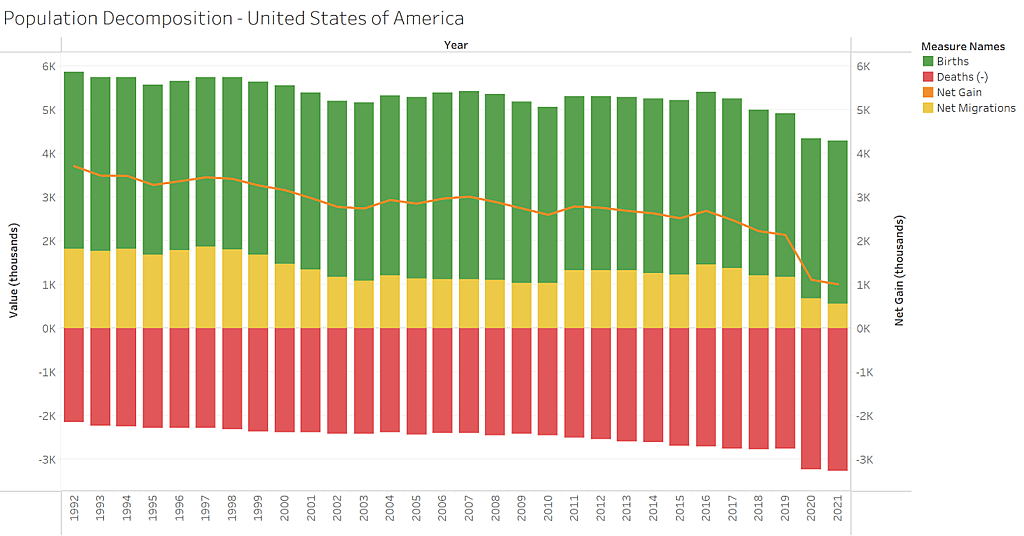
A big wildcard to future population projections is immigration. Trump era policies and COVID travel restrictions have prevented many from coming into this country in recent years. Though not widely released yet, net migration appears to have been lifted by pent up demand in 2022. It’s also important to note, though, that net migration has been declining since the early 1990’s. The chart below breaks down the components of population change. The orange line depicts the declining net population gain over the last 20 years.
What will the future hold?
Although most of this piece is written through the lens of a US businessperson, these trends are happening across most parts of the globe. Even the less developed areas of the world are experiencing similar demographic shifts. People are needed. Workers are needed. As a result, immigrants are beginning to be looked upon differently. Immigration is not just a topic about humanity, but also of economics and future prosperity. Is the world ready for competition for immigrants? (Spoiler alert: It’s already happening actually. But that’s for a different piece.)
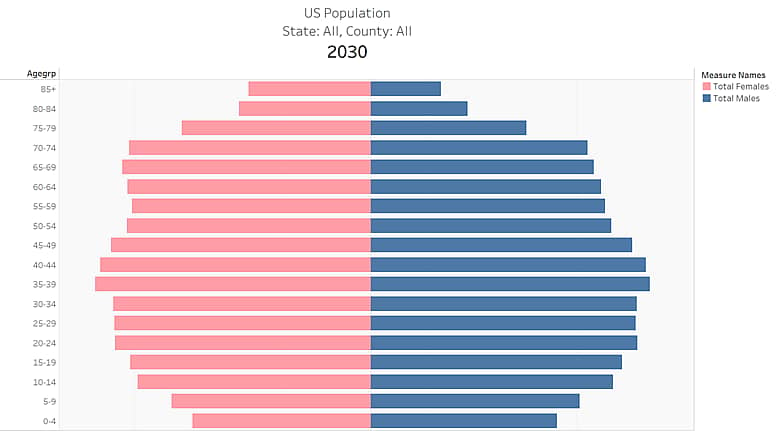
So what does the future hold? Can America cope with future demographic decline? In just a few short years, here’s what it will look like in 2030 (see below).
What does demographic decline mean for you?
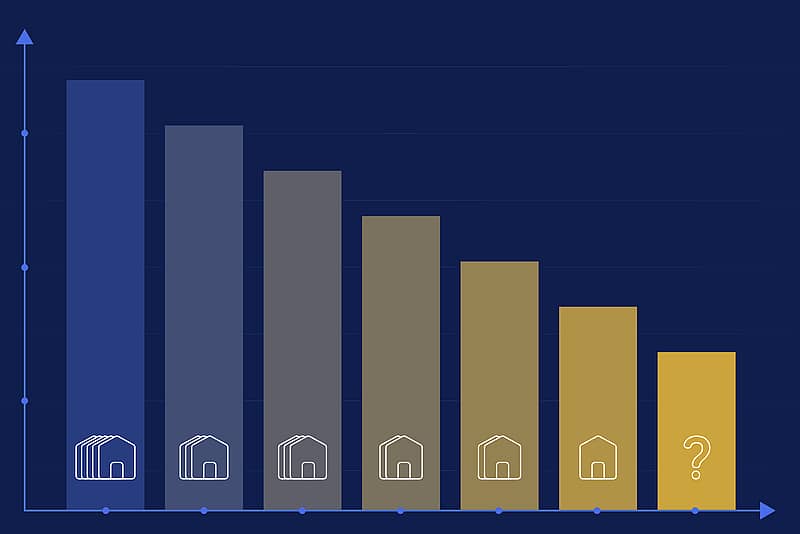
The youngest portion of our society, often referred to as young dependents, is declining first and the fastest. Between 2020 and 2030, our population of children under 15 will likely decline by over 10 million, a reduction of about 17%. Are we prepared for this? 10 million fewer? Basic components of our society need to be reconsidered – child care and schools, medical systems and pediatric care, even goods and services produced. Does your business depend on this age group? Is your strategic planning in place on how best to deal with it?
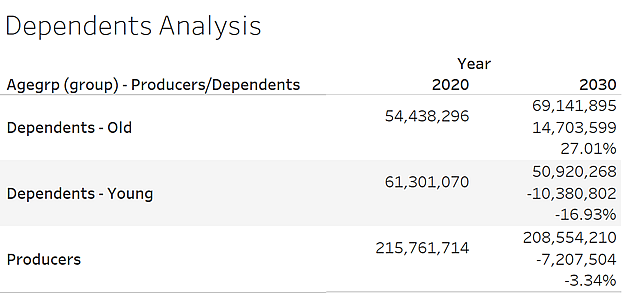
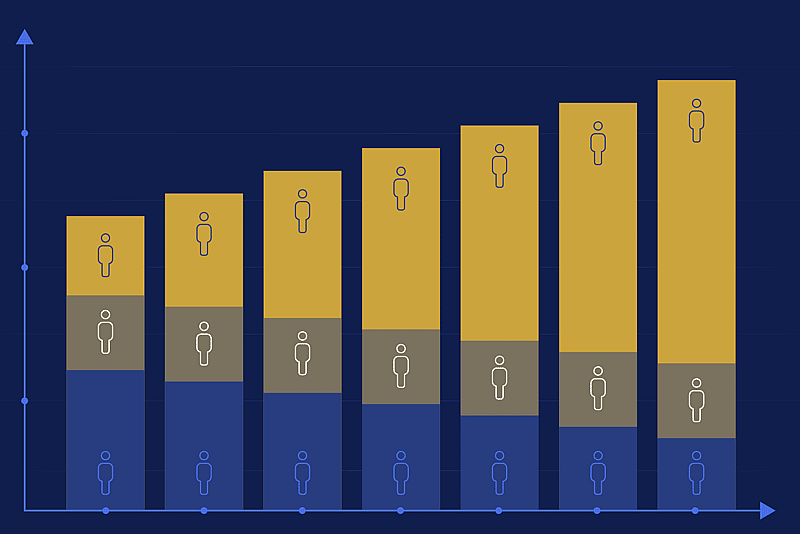
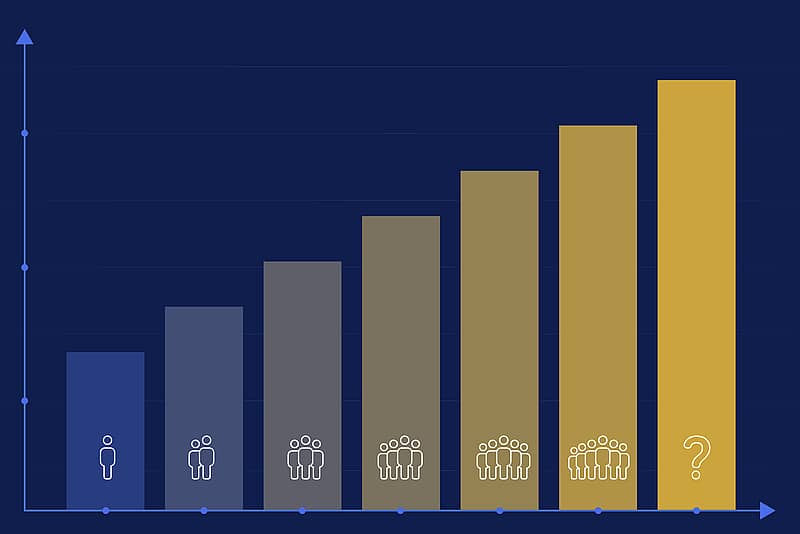
Big, slow-moving trends like this tend to go unnoticed until something makes it appear…like the massive, pandemic induced labor force disruption of the last few years. The decline in the working age population is a big issue. A productive society depends on those who can work and provide for those who can’t. Between 2020 and 2030, the number of older dependents will increase 27% – from 54 million to over 69 million. Almost 15 million more! We’re already seeing major pressure on our hospitals and nurses. Labor disputes and resulting strikes are an indication of things to come.
Important reflections & next steps
To conclude, labor shortages are not going away. In fact, they are going to get worse. Economic recession may take some of the pressure off, but it’s important to know that we will have fewer people – something never seen before. 2030 is not far from now. Now is the time to plan. What can be automated? How can AI be deployed to help improve process and productivity? How do we do more with less?
America’s biggest economic challenge may be demographic decline. Disruption of this magnitude is difficult to fully comprehend. Winners and losers will be determined by preparation and the ability to navigate the rough waters in front of us. Challenges can be minimized, and opportunities can be seized, but problems happen when decisions are made on flawed facts. Understand what’s going on around you. Don’t let the change lead you.