Part 2: US Housing Shortage?
A shortage of homes?
Comparing population size to the number of homes is tricky because many people can live in the same place. Some people live alone, and sometimes multiple families live under the same roof. A better figure to look at when assessing the inventory of homes is the number of households. According to the Census Bureau, the number of households in America increased 9.3 million between 2011 to 2021. During the same period, the total number of housing units in the US increased 9.7 million. At a very high level, this demonstrates that the US has a surplus of over 18 million housing units.
| 2011 | 2021 | |
| Total US Households | 114,750,323 | 124,010,992 |
| Total US Housing Units | 132,319,862 | 142,061,735 |
| Surplus | 17,569,539 | 18,050,743 |
Admittedly, this kind of comparison is not very conclusive. Are all these housing units in reasonable condition? Are they located in the right places? Are they the right size?
Below is a color-coded map showing the excess inventory of housing units and how things have changed from 2010 to 2021. Areas colored dark green have 25% or more excess units. Areas colored dark red have much tighter supplies of homes. You’ll note that over the past 10 years or so, more places appear to be dark green while other areas maintain persistently red. (note: since this view compares the number of households to housing units, vacation areas like Florida or other coastal areas might show more green since they represent homes with no primary residency.)
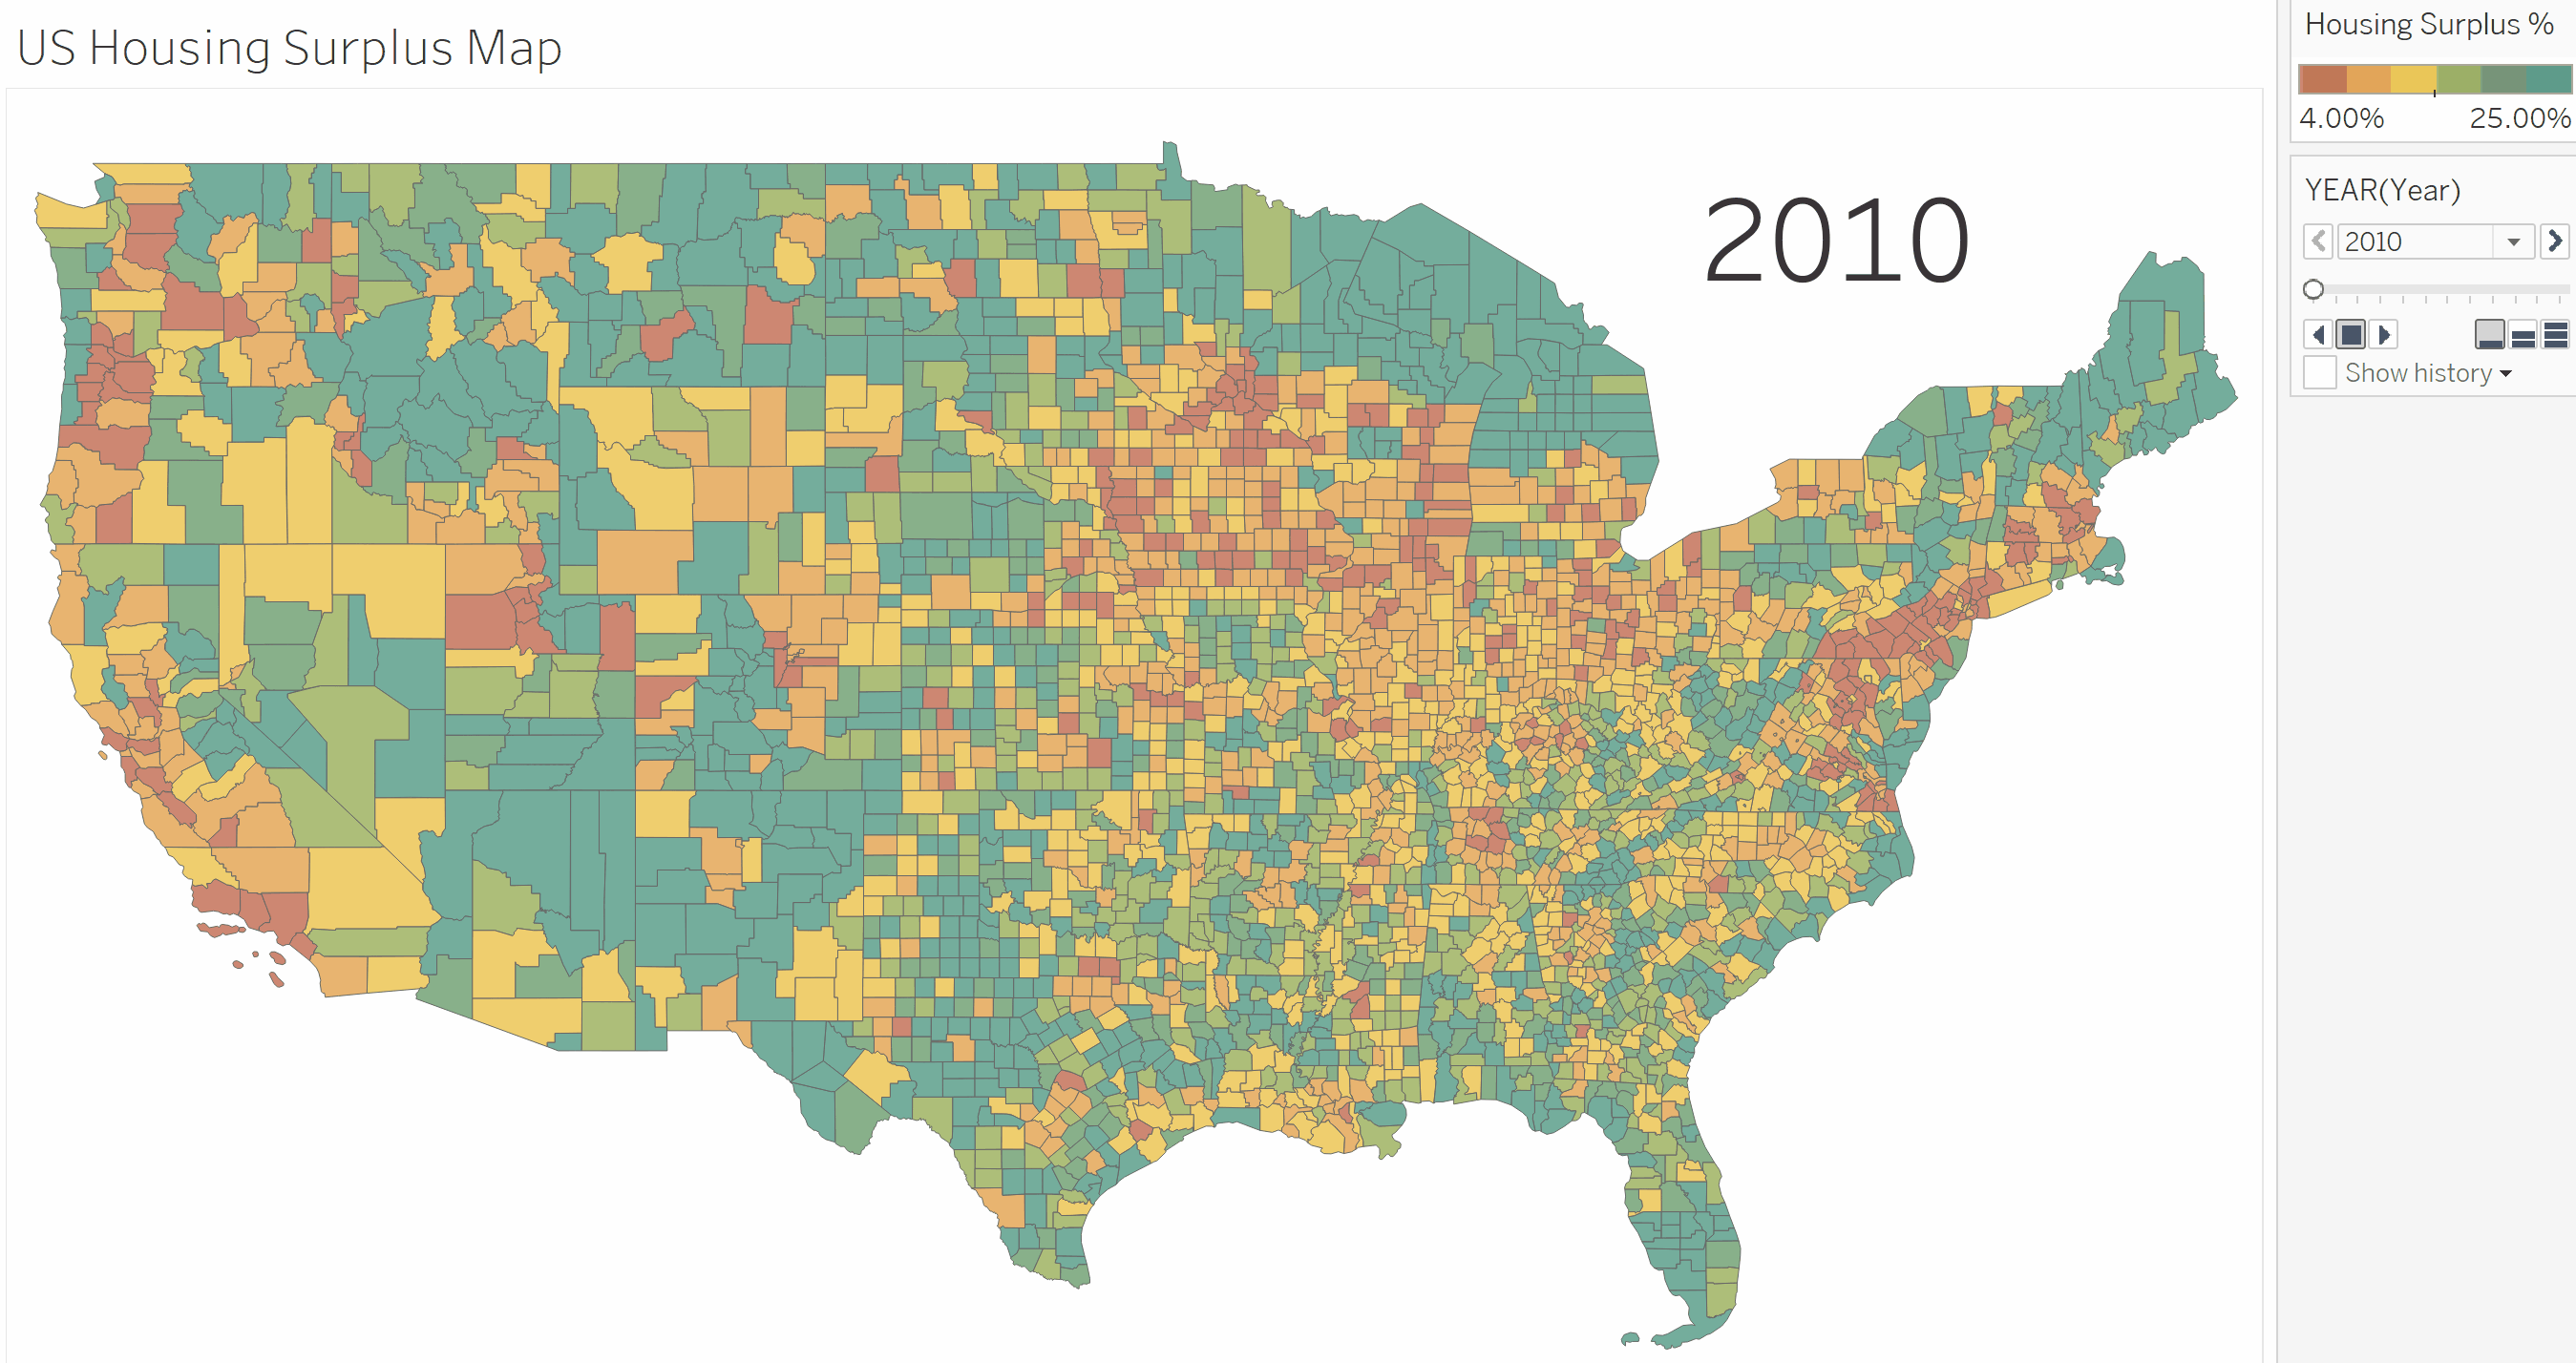
This kind of contextual analysis helps demonstrate the bifurcation that exists today in the US housing market. Media reports of the “housing crisis” suggest a narrative that is different, but are they right? It’s clear from this view that areas like California remain some of the tightest markets in the country while others have plenty of capacity. Do we have a shortage of homes or are we perhaps seeing a shift of some sorts happening?
Prolonged periods of low borrowing costs have helped fuel home sales resulting in higher values. Strong return on investment ratios have also added momentum by attracting the financial resources of large investor groups. Do the laws of supply and demand support the radical appreciation of home values that we’ve seen in recent years?
Do we have the right types of homes?
The makeup of our society is changing in ways never seen before. Baby boomers represent a large portion of our population, and they are also generally living longer than previous older generations. Younger people are getting married at later ages and having fewer children. Many choose not to have children at all. These societal shifts require changes in all aspects of goods and services offered. Station wagons and minivans have gone away and been replaced with smaller, more practical SUV’s. The American family has changed and so must our housing.
A greater portion of people are living alone these days – from 27.2% of our population in 2010 to 28.1% of our population in 2021. Moreover, the number of people living alone that are over 65, increased from 9.3% in 2010 to 11.2% in 2021.
| 2010 | 2021 | |
| % of US Households Living Alone | 27.2% | 28.1% |
| % of US Households Living Alone – Over 65 | 9.3% | 11.2% |
Also, an important inflection point happened in early 2012. The number of households with people over the age of 60 became a greater number than the number of households with people under 18. As you can see from the chart below, the difference has become large, and it has happened fast. This gap will only continue to grow in the future due to current fertility trends and increasing life expectancies.

Does our housing inventory line up with these trends? As you can see from the chart below, most housing units in America are single family homes. When our society looked like the population pyramid from 1970, we clearly had needs for homes large enough for families to grow in, yet our needs are changing.

Some single-family homes can reasonably be modified to be more comfortable for older people. Larger homes can be divided into smaller places. Many homes, though, are simply too big and impractical for senior living. Staircases are hard to navigate, and property is difficult to maintain.
So…are we planning differently based on these changes? Below is a look at building permits between 2010 and 2021. As you can see, single family houses continue to be the dominant share of new construction.


