Part 1: US Population Growth
A friend in the real estate business recently asked me to comment on some words spoken by Lawrence Yun, Chief Economist of National Association of Realtors (NAR).
“Every decade we’re adding about 20 million more people in the country and if we don’t build new homes, one wonders, where do they live. So, of course, we need to build new homes.” Yun said.
NAR put out a report in 2019 identifying a shortfall in home inventory across the country. A 2021 revision of the report, featured by CNBC and other media outlets gained some attention suggesting that America needs over 5.2 million new homes. Their analysis is rooted in a comparison of population growth and new home construction – more people need more homes essentially.
Intuitively, that makes sense – right? There are only so many homes for people to live in and new ones need to be built if population continues to grow. Something about this doesn’t add up to me, though. Headlines are designed to get attention and big round numbers get attention. 20 million more people every decade. 5 million homes are needed. Today’s world of near instant communication allows small headlines to grow into narratives that can quickly turn into acceptance of truth.
Is America adding 20 million people per year?
US Census Bureau numbers do in fact show that total US population increased 20.3 million in the 10 years between 2011 and 2021.
| 2011 | 2021 | Difference | |
| Total US Population | 311,547,134 | 331,893,745 | 20,346,611 |
Data points need to be put in context to be meaningful, though. Changes in population size are dependent on the number of people who are born, the number of people that die, and the number of people that move. Below is a chart that shows the components of population change over the past 30 years. Green bars represent births in that year, red bars show deaths, and yellow bars is the net result of people moving in and out of the country. The orange line is the compilation of the numbers – overall population change.

Note the relative size of the green bars as compared to the red bars. 30 years ago, there were about two births for every one death. The ratio today is more like 1 to 1. Yes, COVID certainly caused more deaths to happen in 2020 and 2021, but it’s important to note the ratio was 1.3 to 1 in 2019 – before COVID. The reduction in the number of births is a result of a much unnoticed trend of declining fertility. If births and deaths are roughly equal, population change is then determined by migration and there are fewer people coming to America these days.
Trump era policies certainly didn’t encourage immigration, yet net migration also declined during the Obama years. With COVID and Trump policies now behind us, will we see a rebound in immigration? Probably. High water marks over the past 30 years hovered just over 1 million. For population to increase another 20 million people in 10 years, we would need to see that number double. That doesn’t seem likely to me.
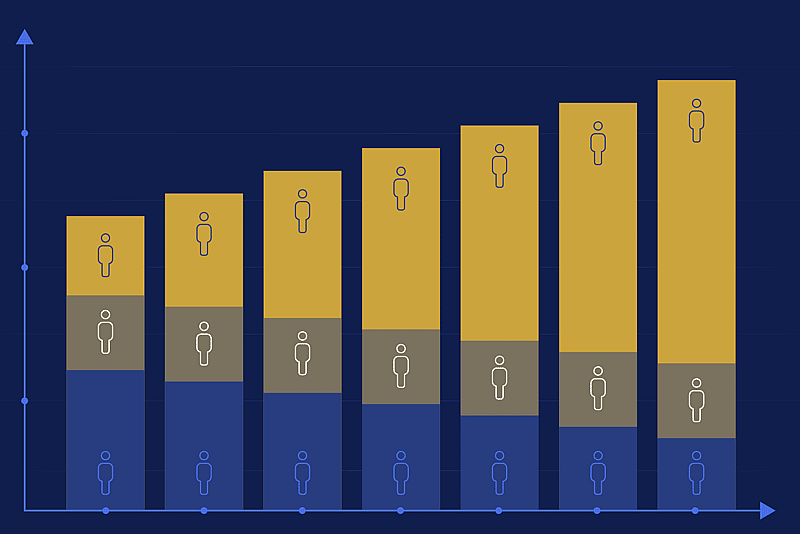
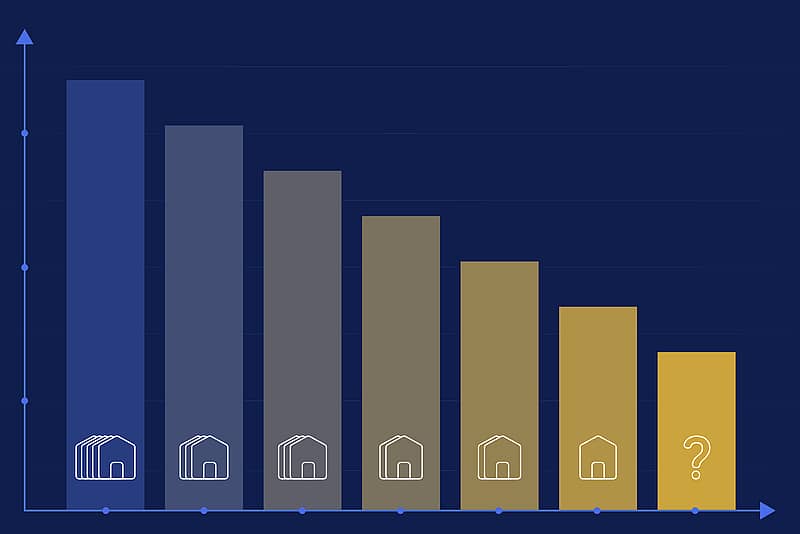
The impacts of declining fertility rates are just now becoming visible, and this is happening at the same time when baby boomers are aging. Our society’s size and shape are changing (see charts below).


Immigration is a wildcard and hard to predict, yet when accounting for lower fertility rates, our projected population growth is coming to a screeching halt and will soon begin to decline.